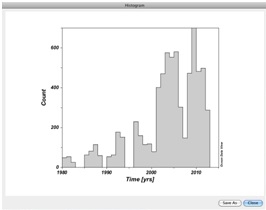
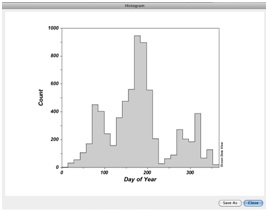
IBAMar database gathered profile collections. Different oceanographic stations are grouped by cruises. A group of oceanographic stations are identified as a cruise if they are collected in the same vessel during a specific time period.
Each oceanographic station includes a header with metadata and a matrix with the data values. Station headers contain the cruise name, the research vessel, the station number, the date, the time, the location, the CTD type or Bottle and the bottom depth. The matrix of data includes the data values of the different parameters organized by columns with the units indicated in the followong table:
Table: IBAMar database parameters and units
| Parameter | Unit |
| Pressure | dbar |
| Temperature | C |
| Salinity | (PSU) |
| Dissolved oxygen | ml l |
| Fluorescence | mg m |
| Turbidity | FTU |
| Nitrate | μM |
| Nitrite | μM |
| Phosphate | μM |
| Silicate | μM |
| Chlorophyll-a | mg m |
IBAMar can be handled with the Ocean Data View (ODV) software , available at http://odv.awi.de/, which allows an interactive exploration, analysis and visualization of the spatial and temporal distribution of data and the visualizations of the profiles.
Metadata exploration
New data are included in the database every 6 months. Metadata will be freely accessible from this website, IbaMar Metadata.
Ocean Data View software (ODV), available at http://odv.awi.de/, has to be used for visualization. Follow the instructions to install the software and in menu File>open choose the file IBAMar_metadata.odv. You will observe a map with the station distribution and a box indicating the metadata variables.
Clicking the right mouse button and choosing “station selection criteria” it is possible to select a temporal or spatial range of stations or define the project or campaign name. It is also possible to impose requirements over bottom depth or maximum measured pressure to define a subset of stations.
Clicking the right mouse button and choosing “statistics” it is possible to get the year and seasonal histogram and the spatial histogram of the subset previously defined.
In this way users can have an idea on the available data to decide if IBAMar can help them to answer their questions. IBAMar data providers will be very glad to collaborate in any effort to improve the scientific exploration of their data.


